


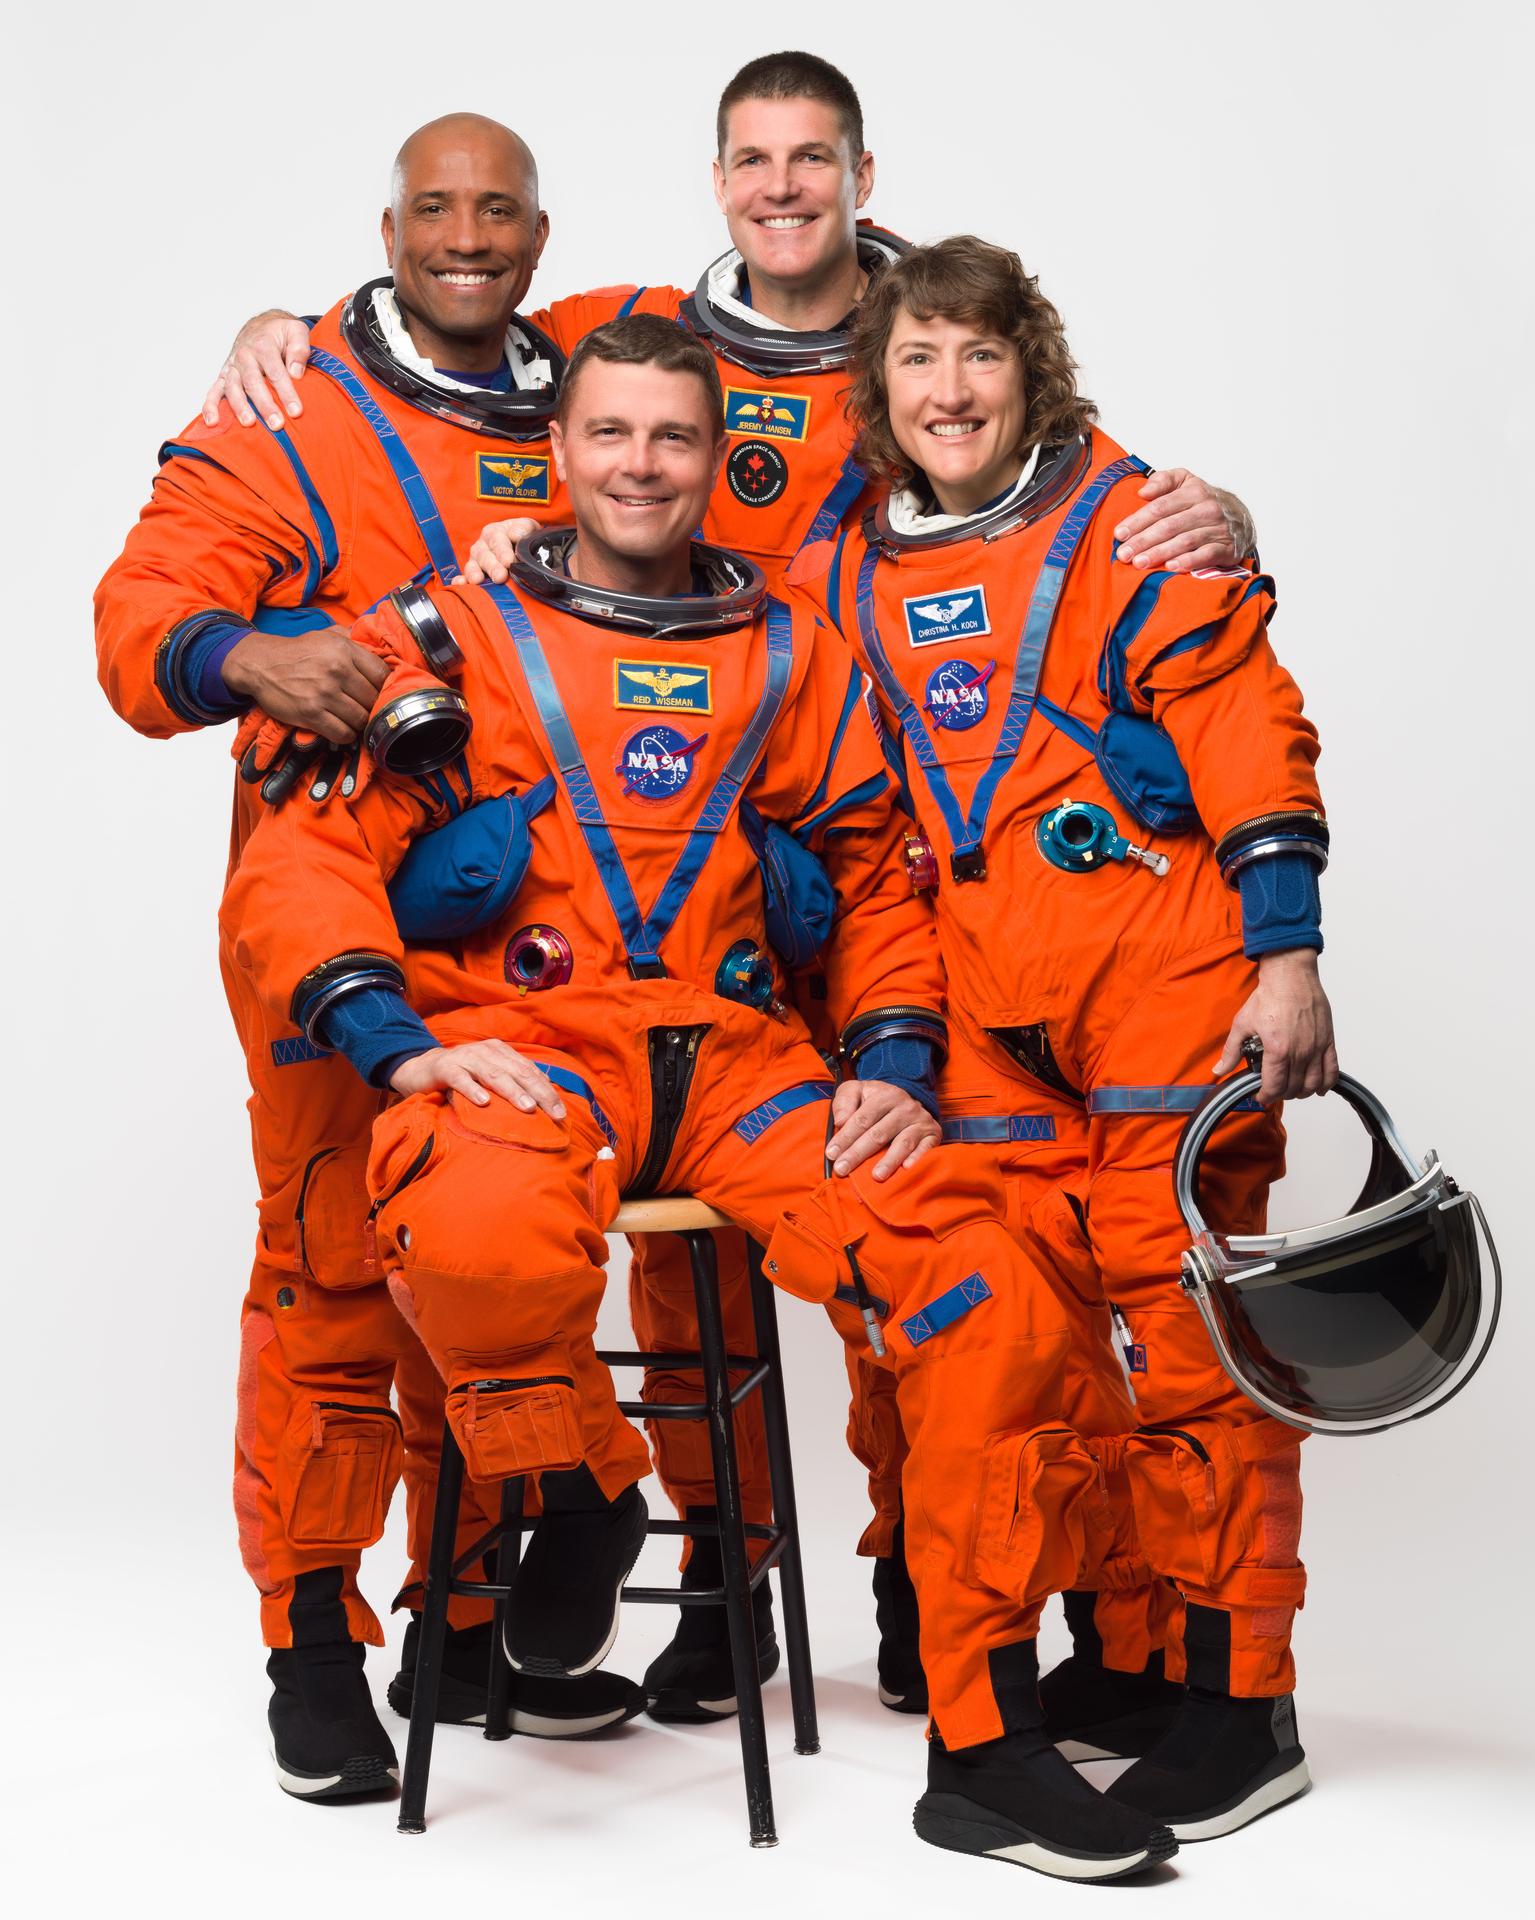
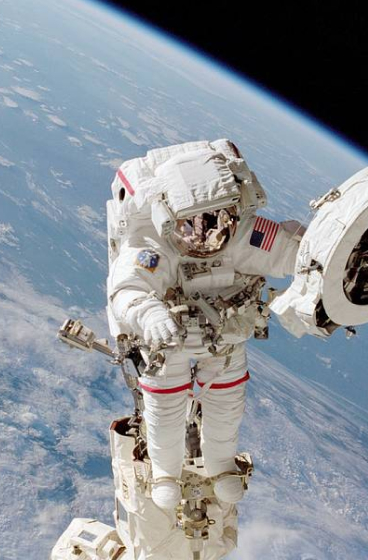
MORE THAN ASTRONAUTS
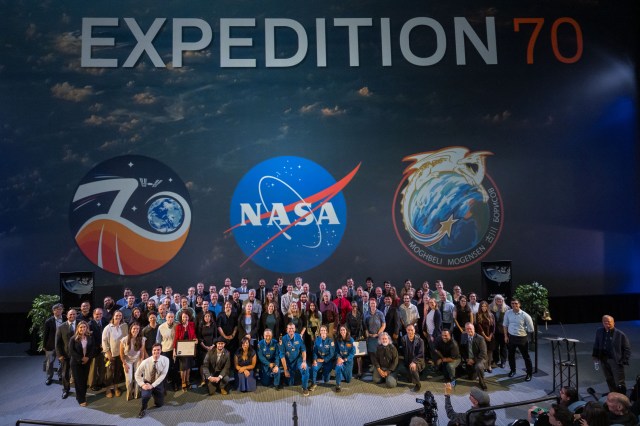
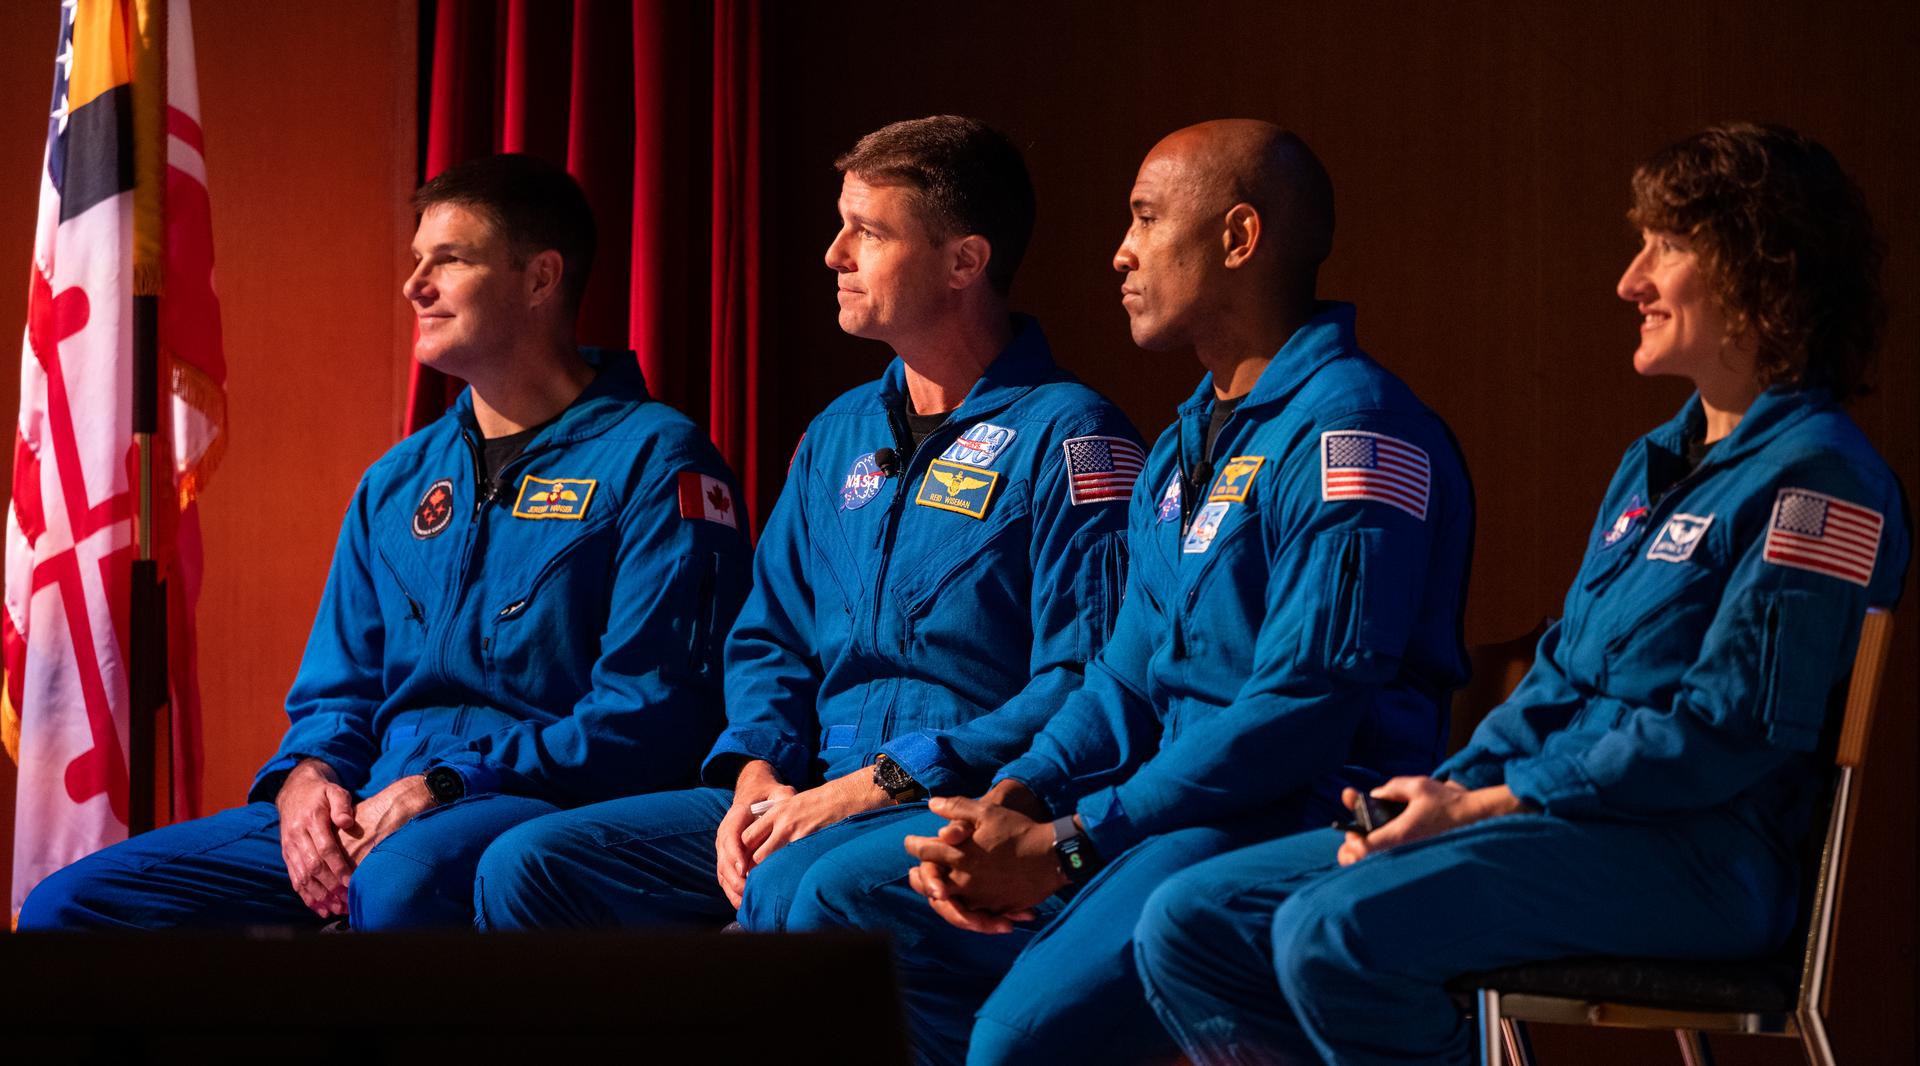
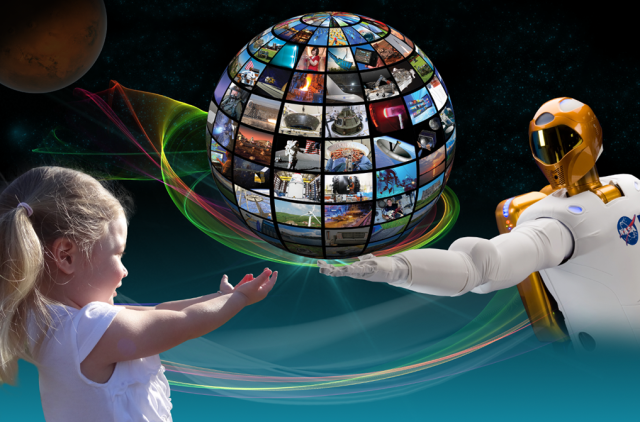
People of NASAFOR THE BENEFIT OF ALL
NASA MissionsCONTRIBUTE TO NASA MISSIONS
Join Us
COMMERCIAL POTENTIAL
NASA’s Patent PortfolioTECHNICAL APPLICATIONS
NASA’s Software CatalogNEW VENTURE CREATION
Technology Transfer Expansion
Featured News

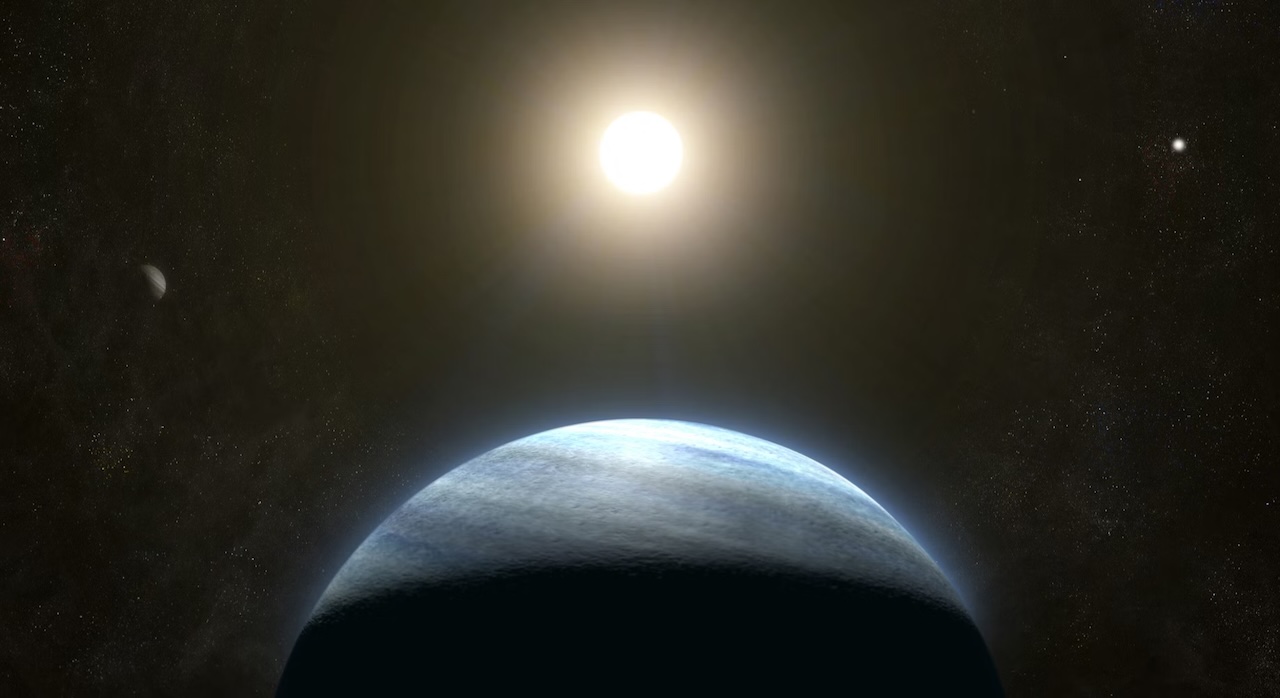
Discovery Alert: Mini-Neptune in Double Star System is a Planetary Puzzle

NASA Tool Gets Ready to Image Faraway Planets

Asian-American and Native Hawaiian Pacific Islander Heritage Month
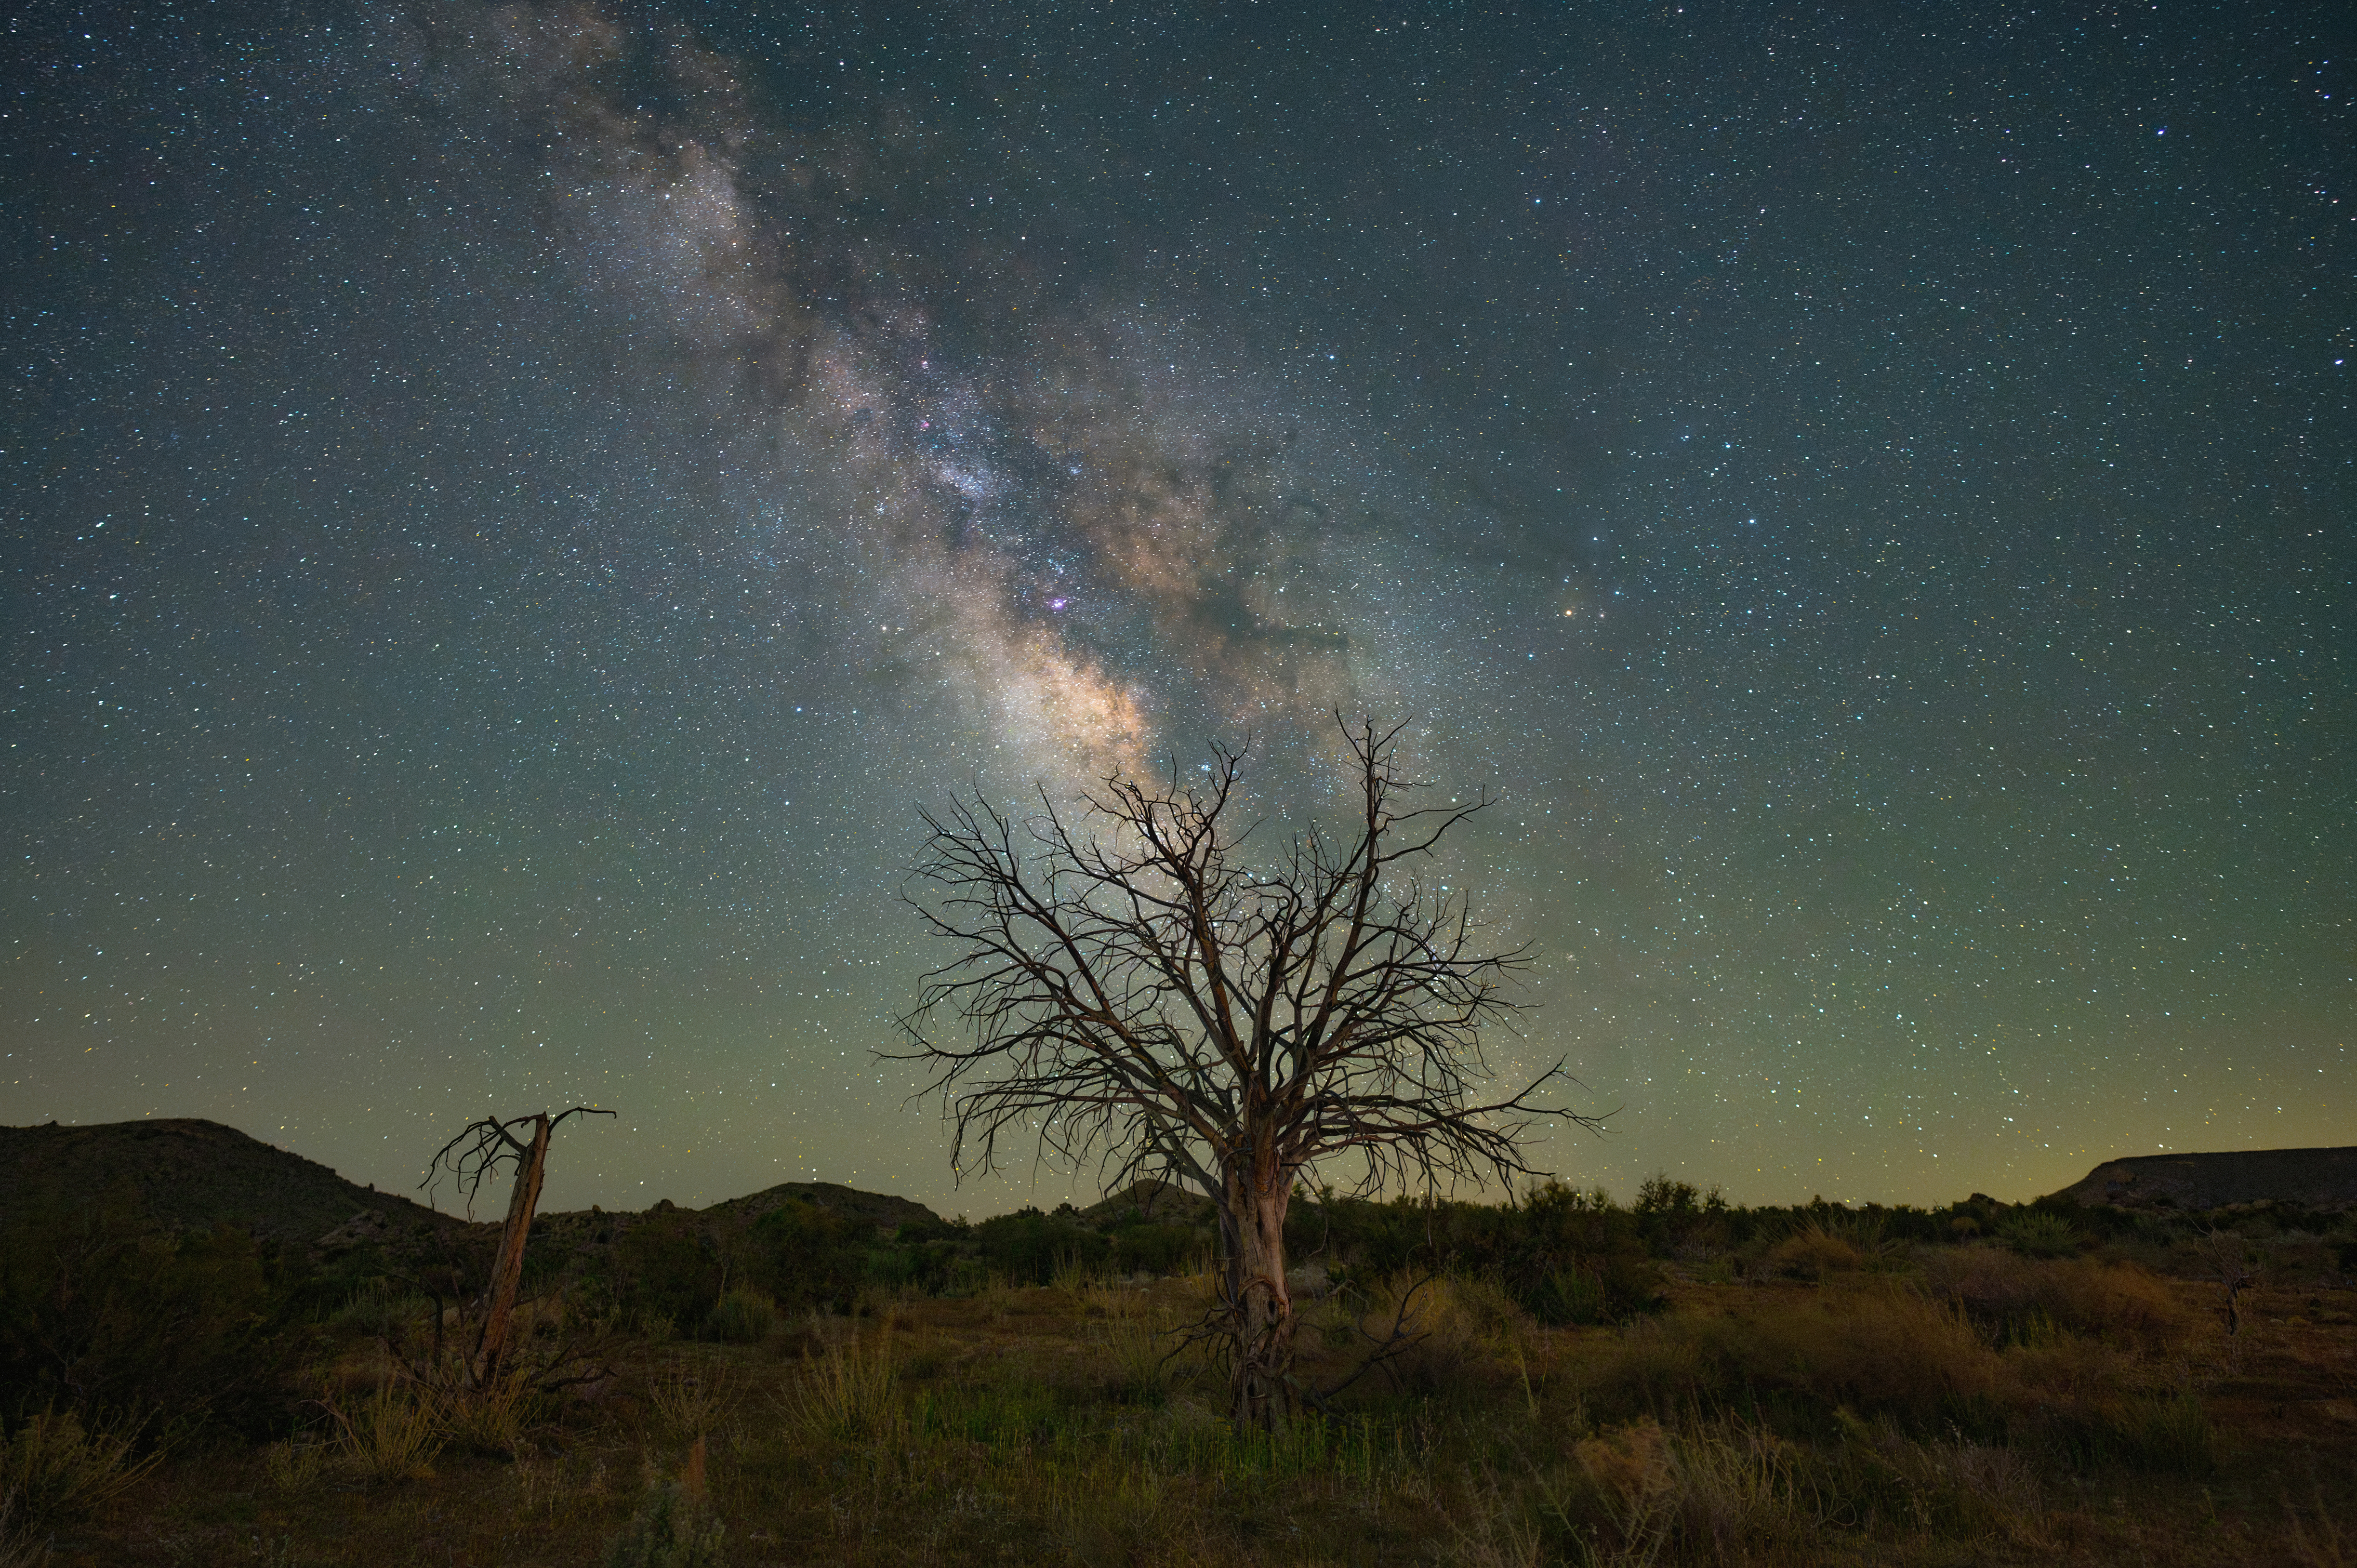
What’s Up: May 2024 Skywatching Tips from NASA
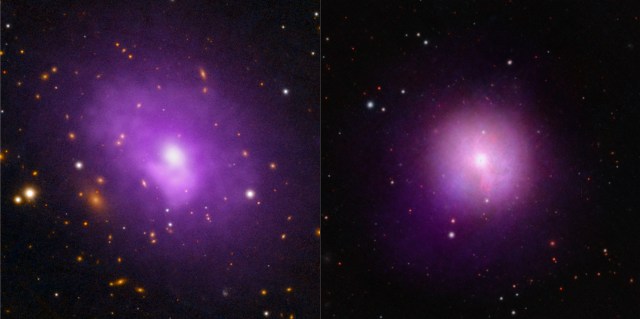
Case of the Inflated Exoplanet
Why is the warm gas-giant exoplanet WASP-107 b so puffy? Using data collected by NASA’s James Webb Space Telescope, combined with prior observations from NASA’s Hubble Space Telescope, two independent research teams have an answer.
Learn More about Case of the Inflated Exoplanet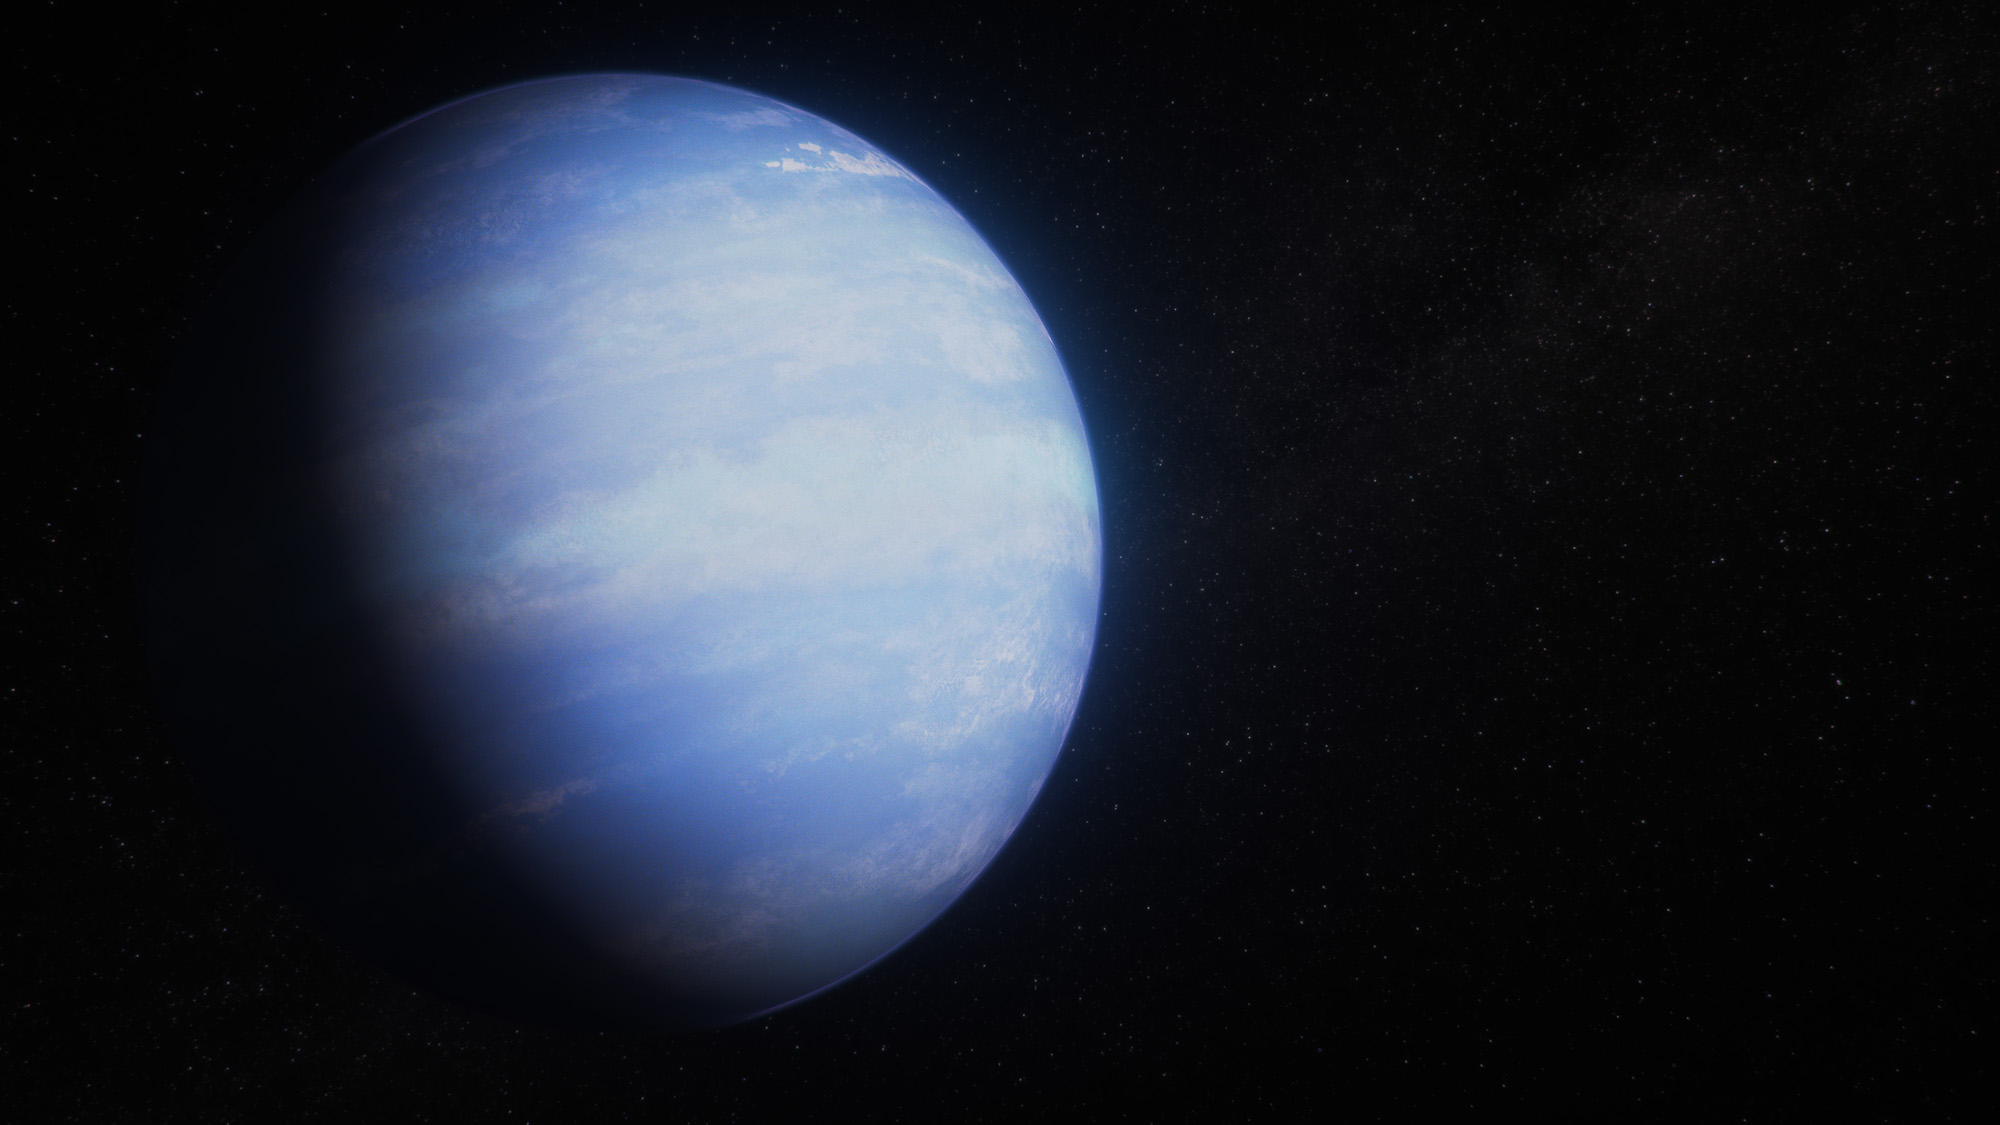
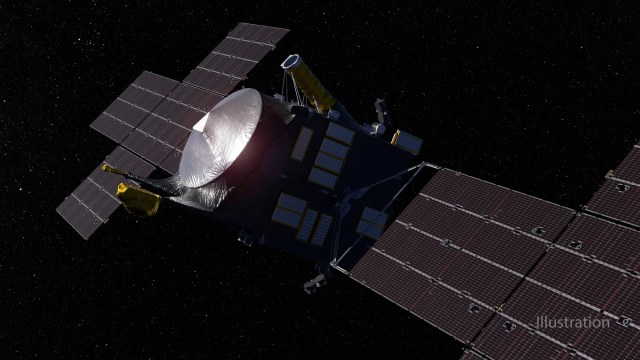
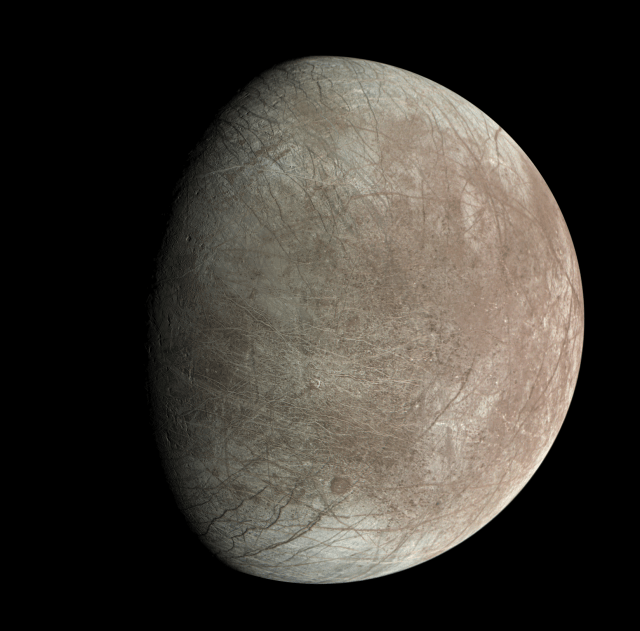
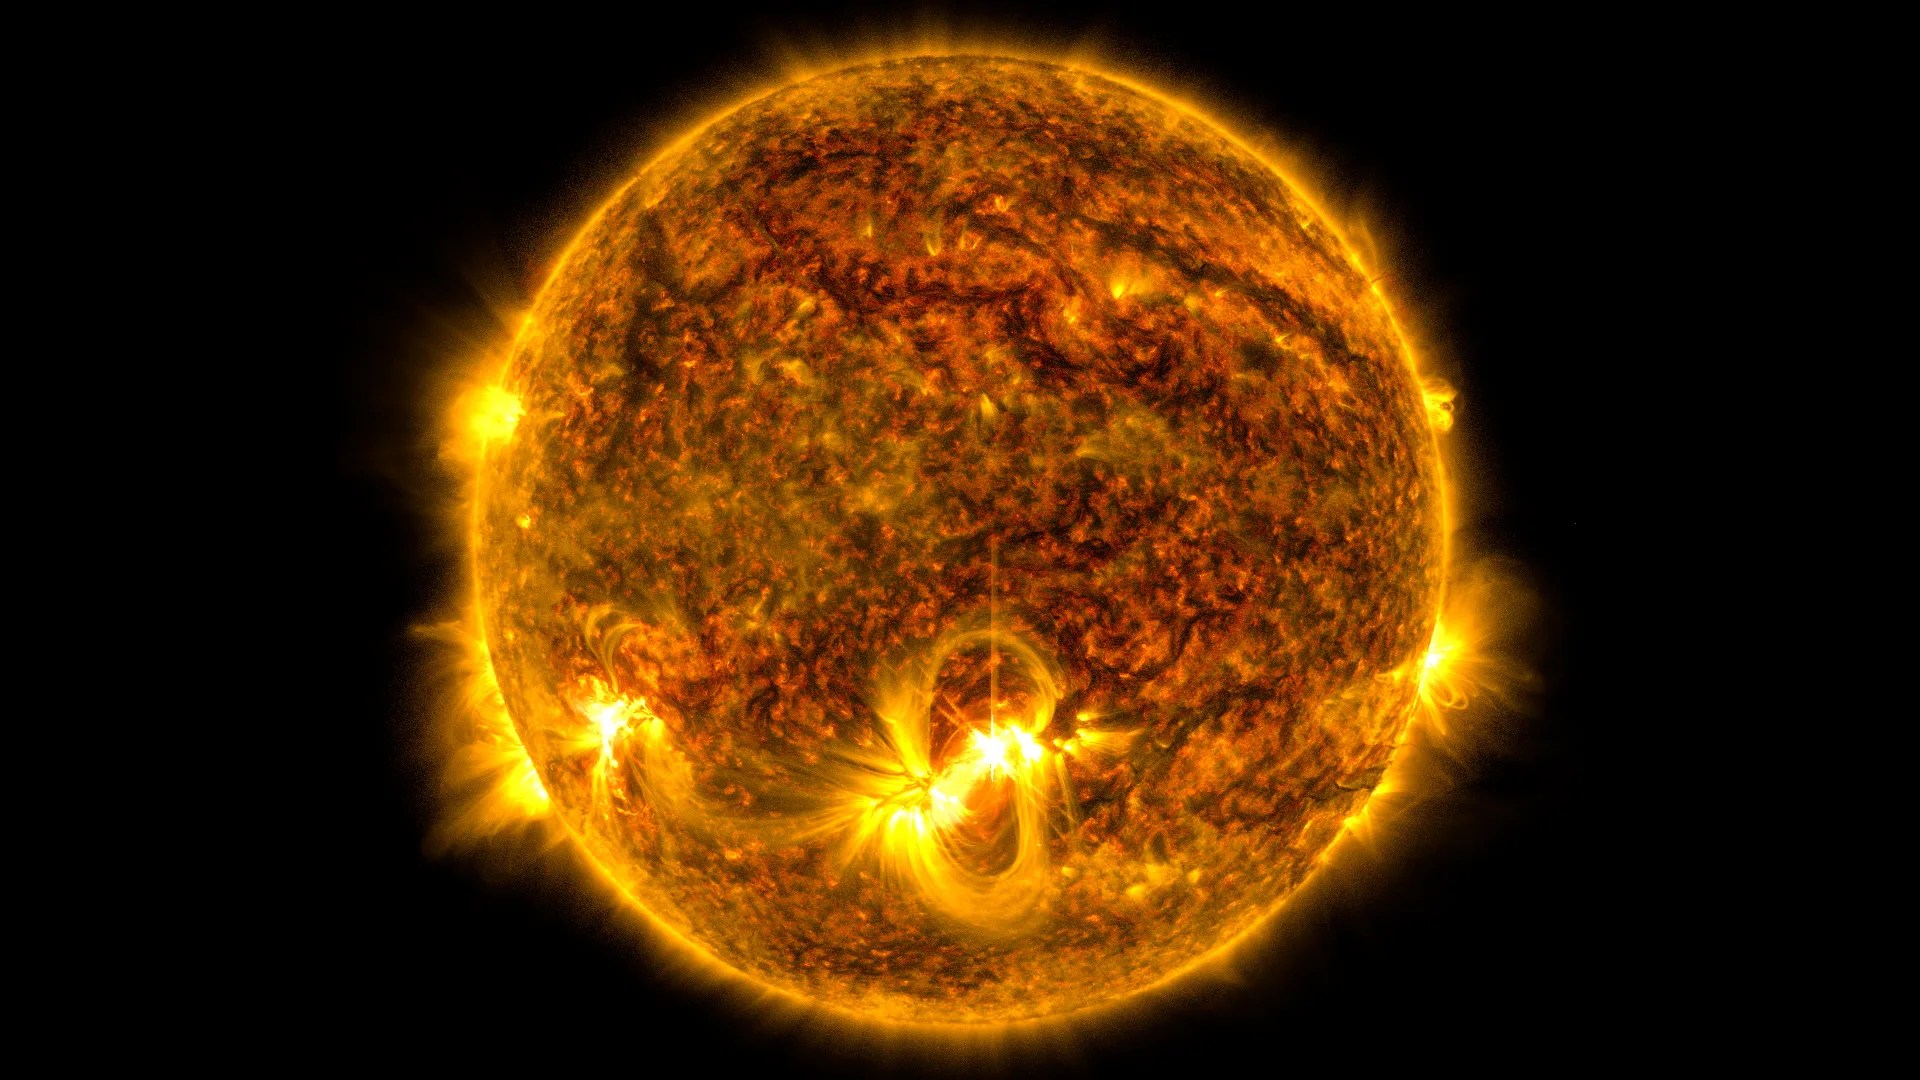
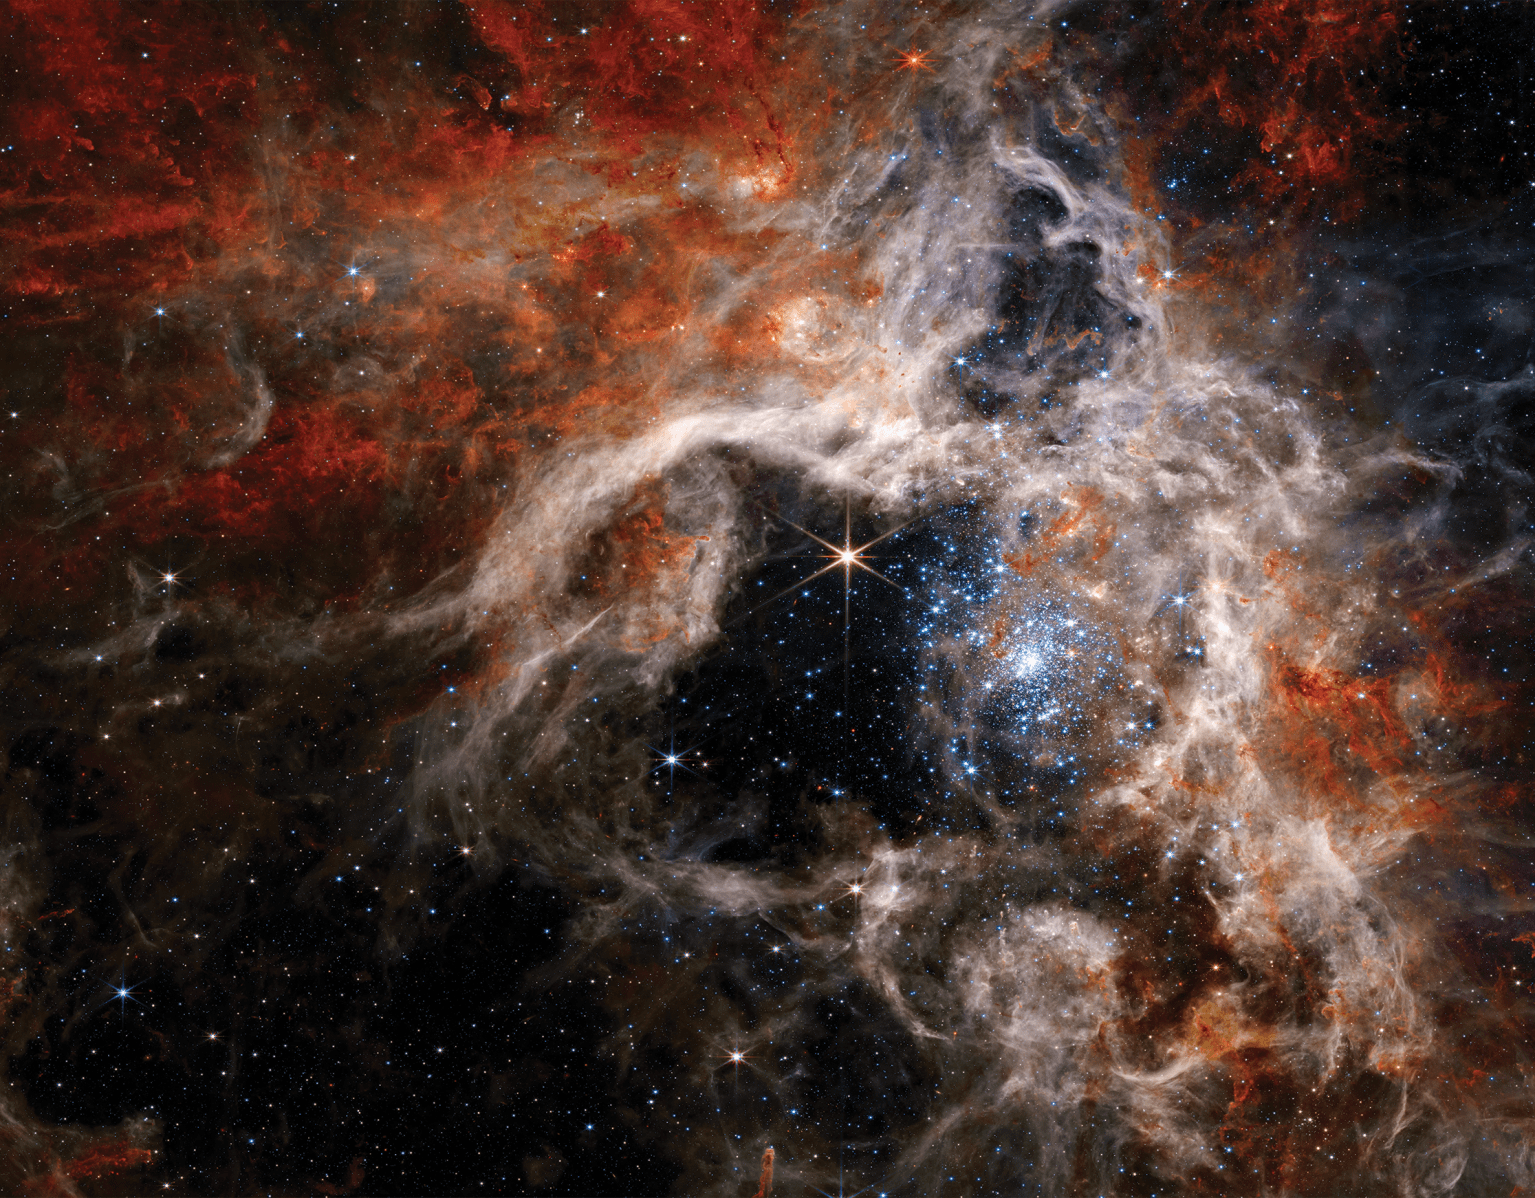
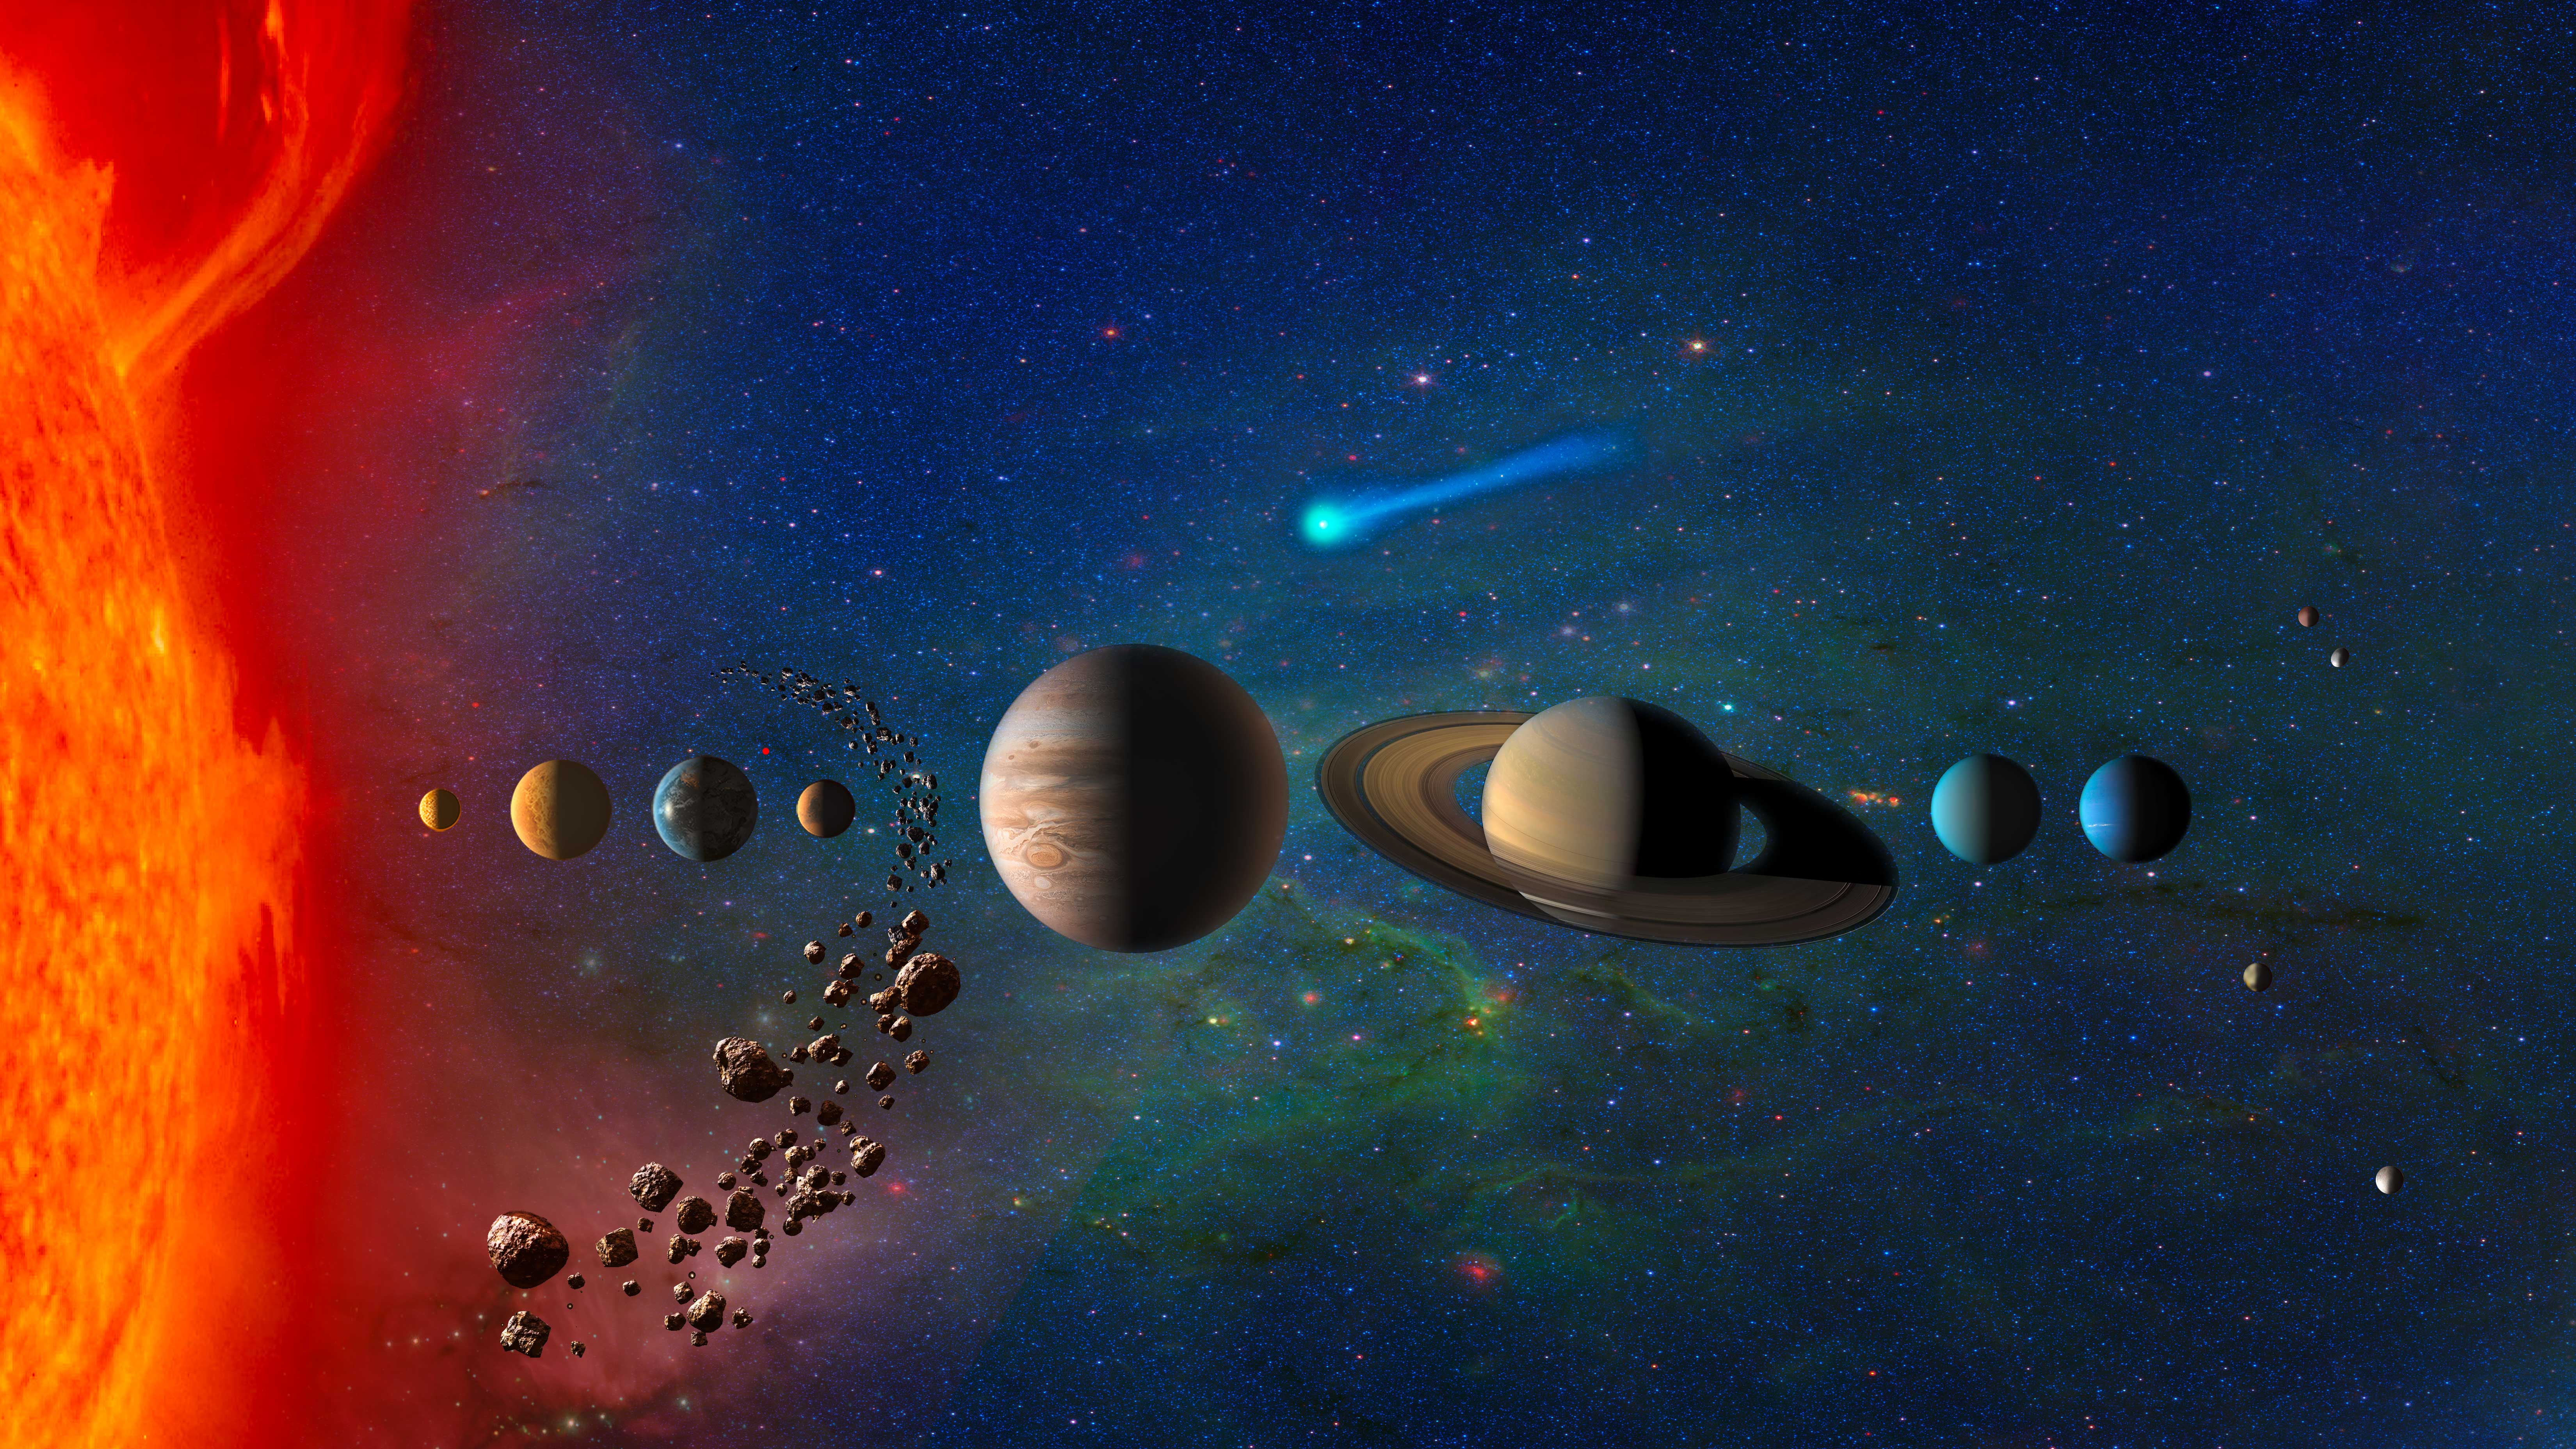
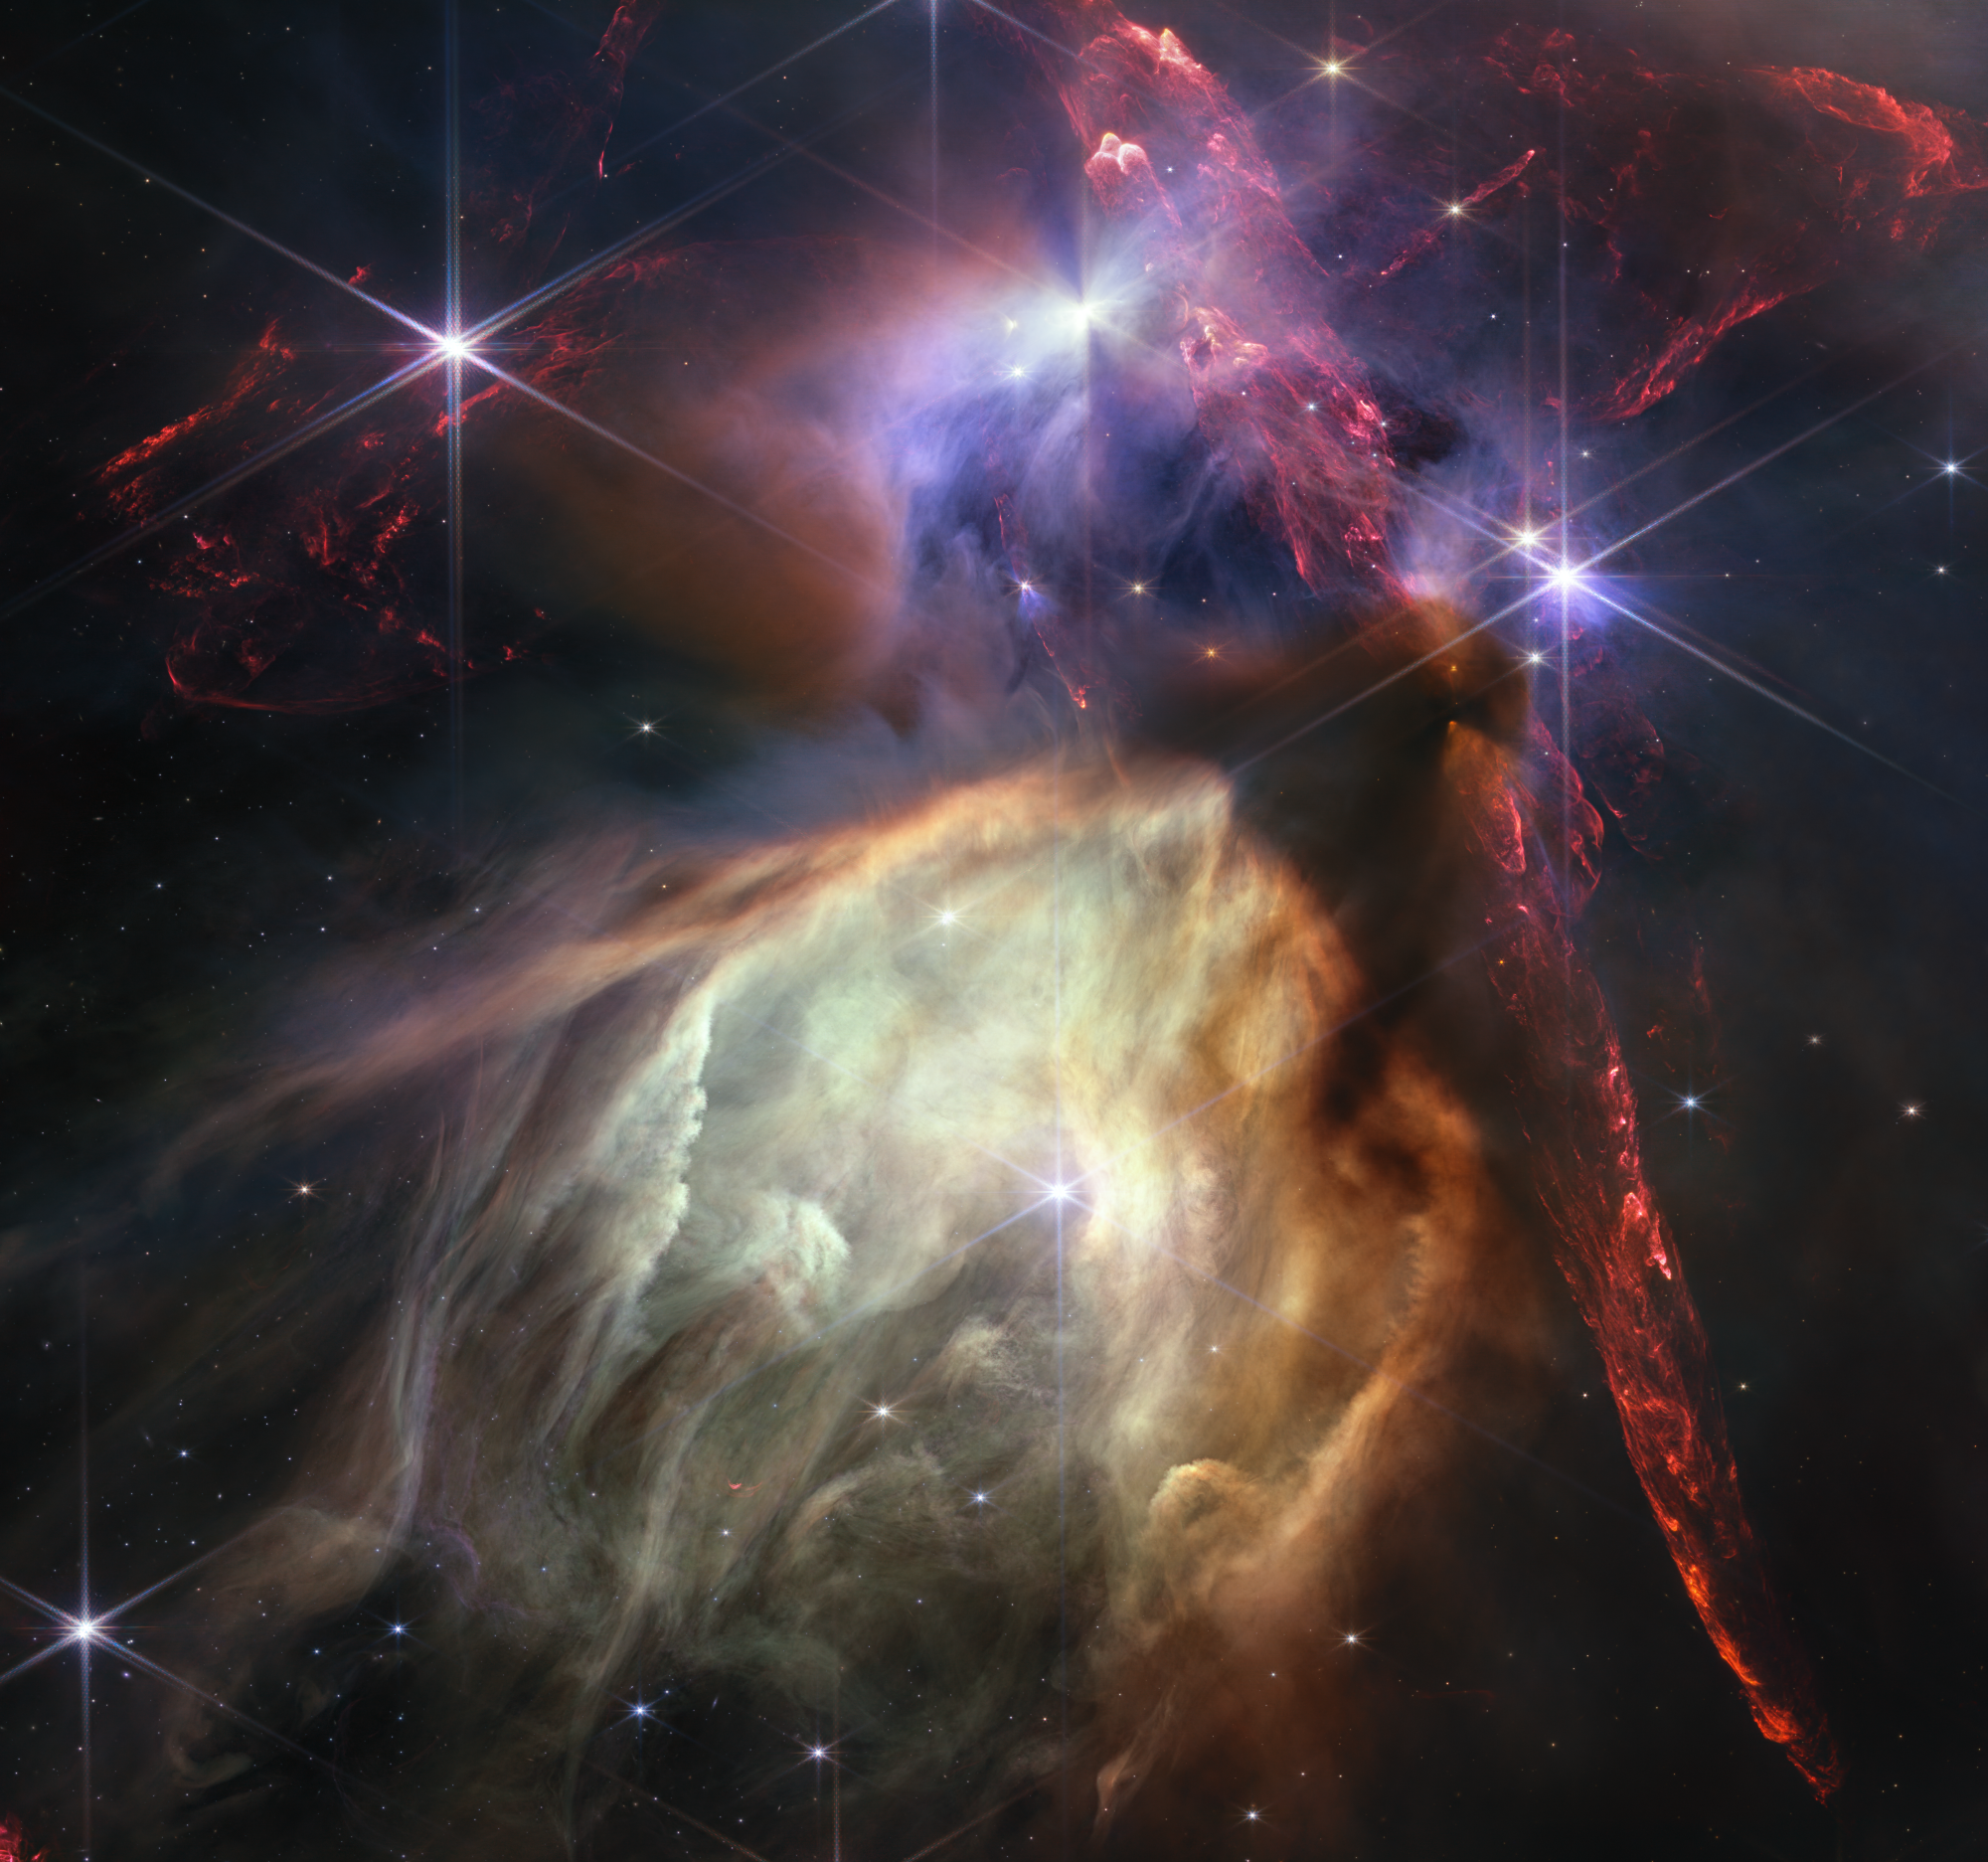
Welcome to the Universe


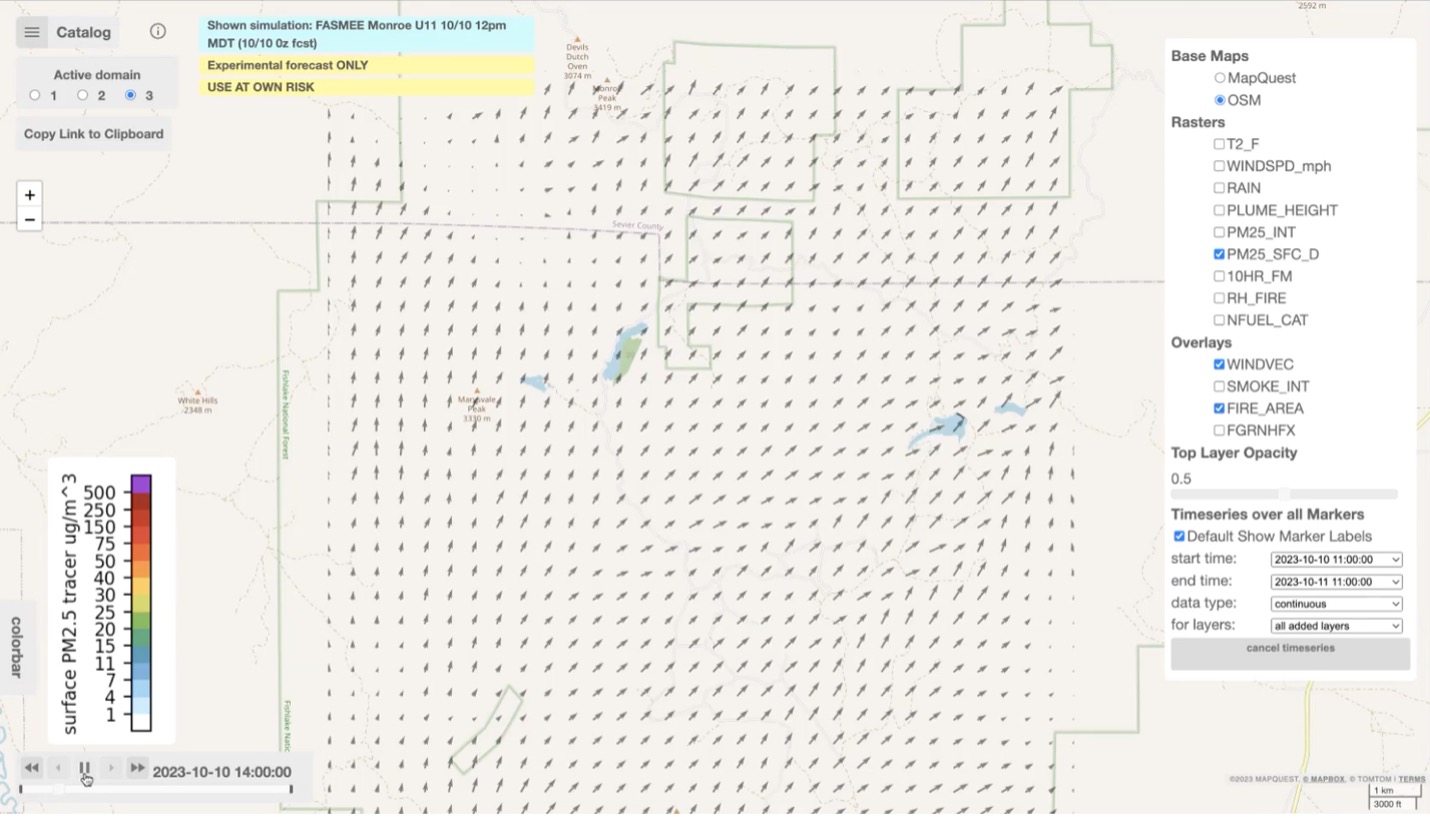
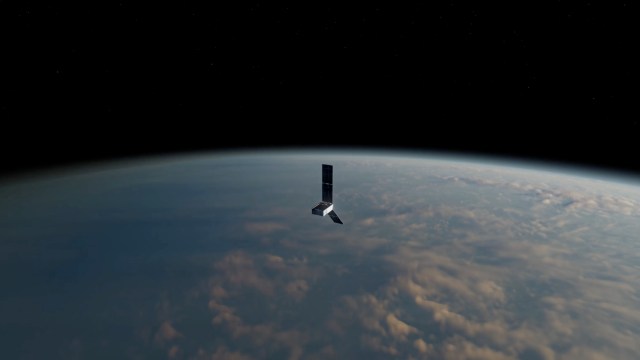
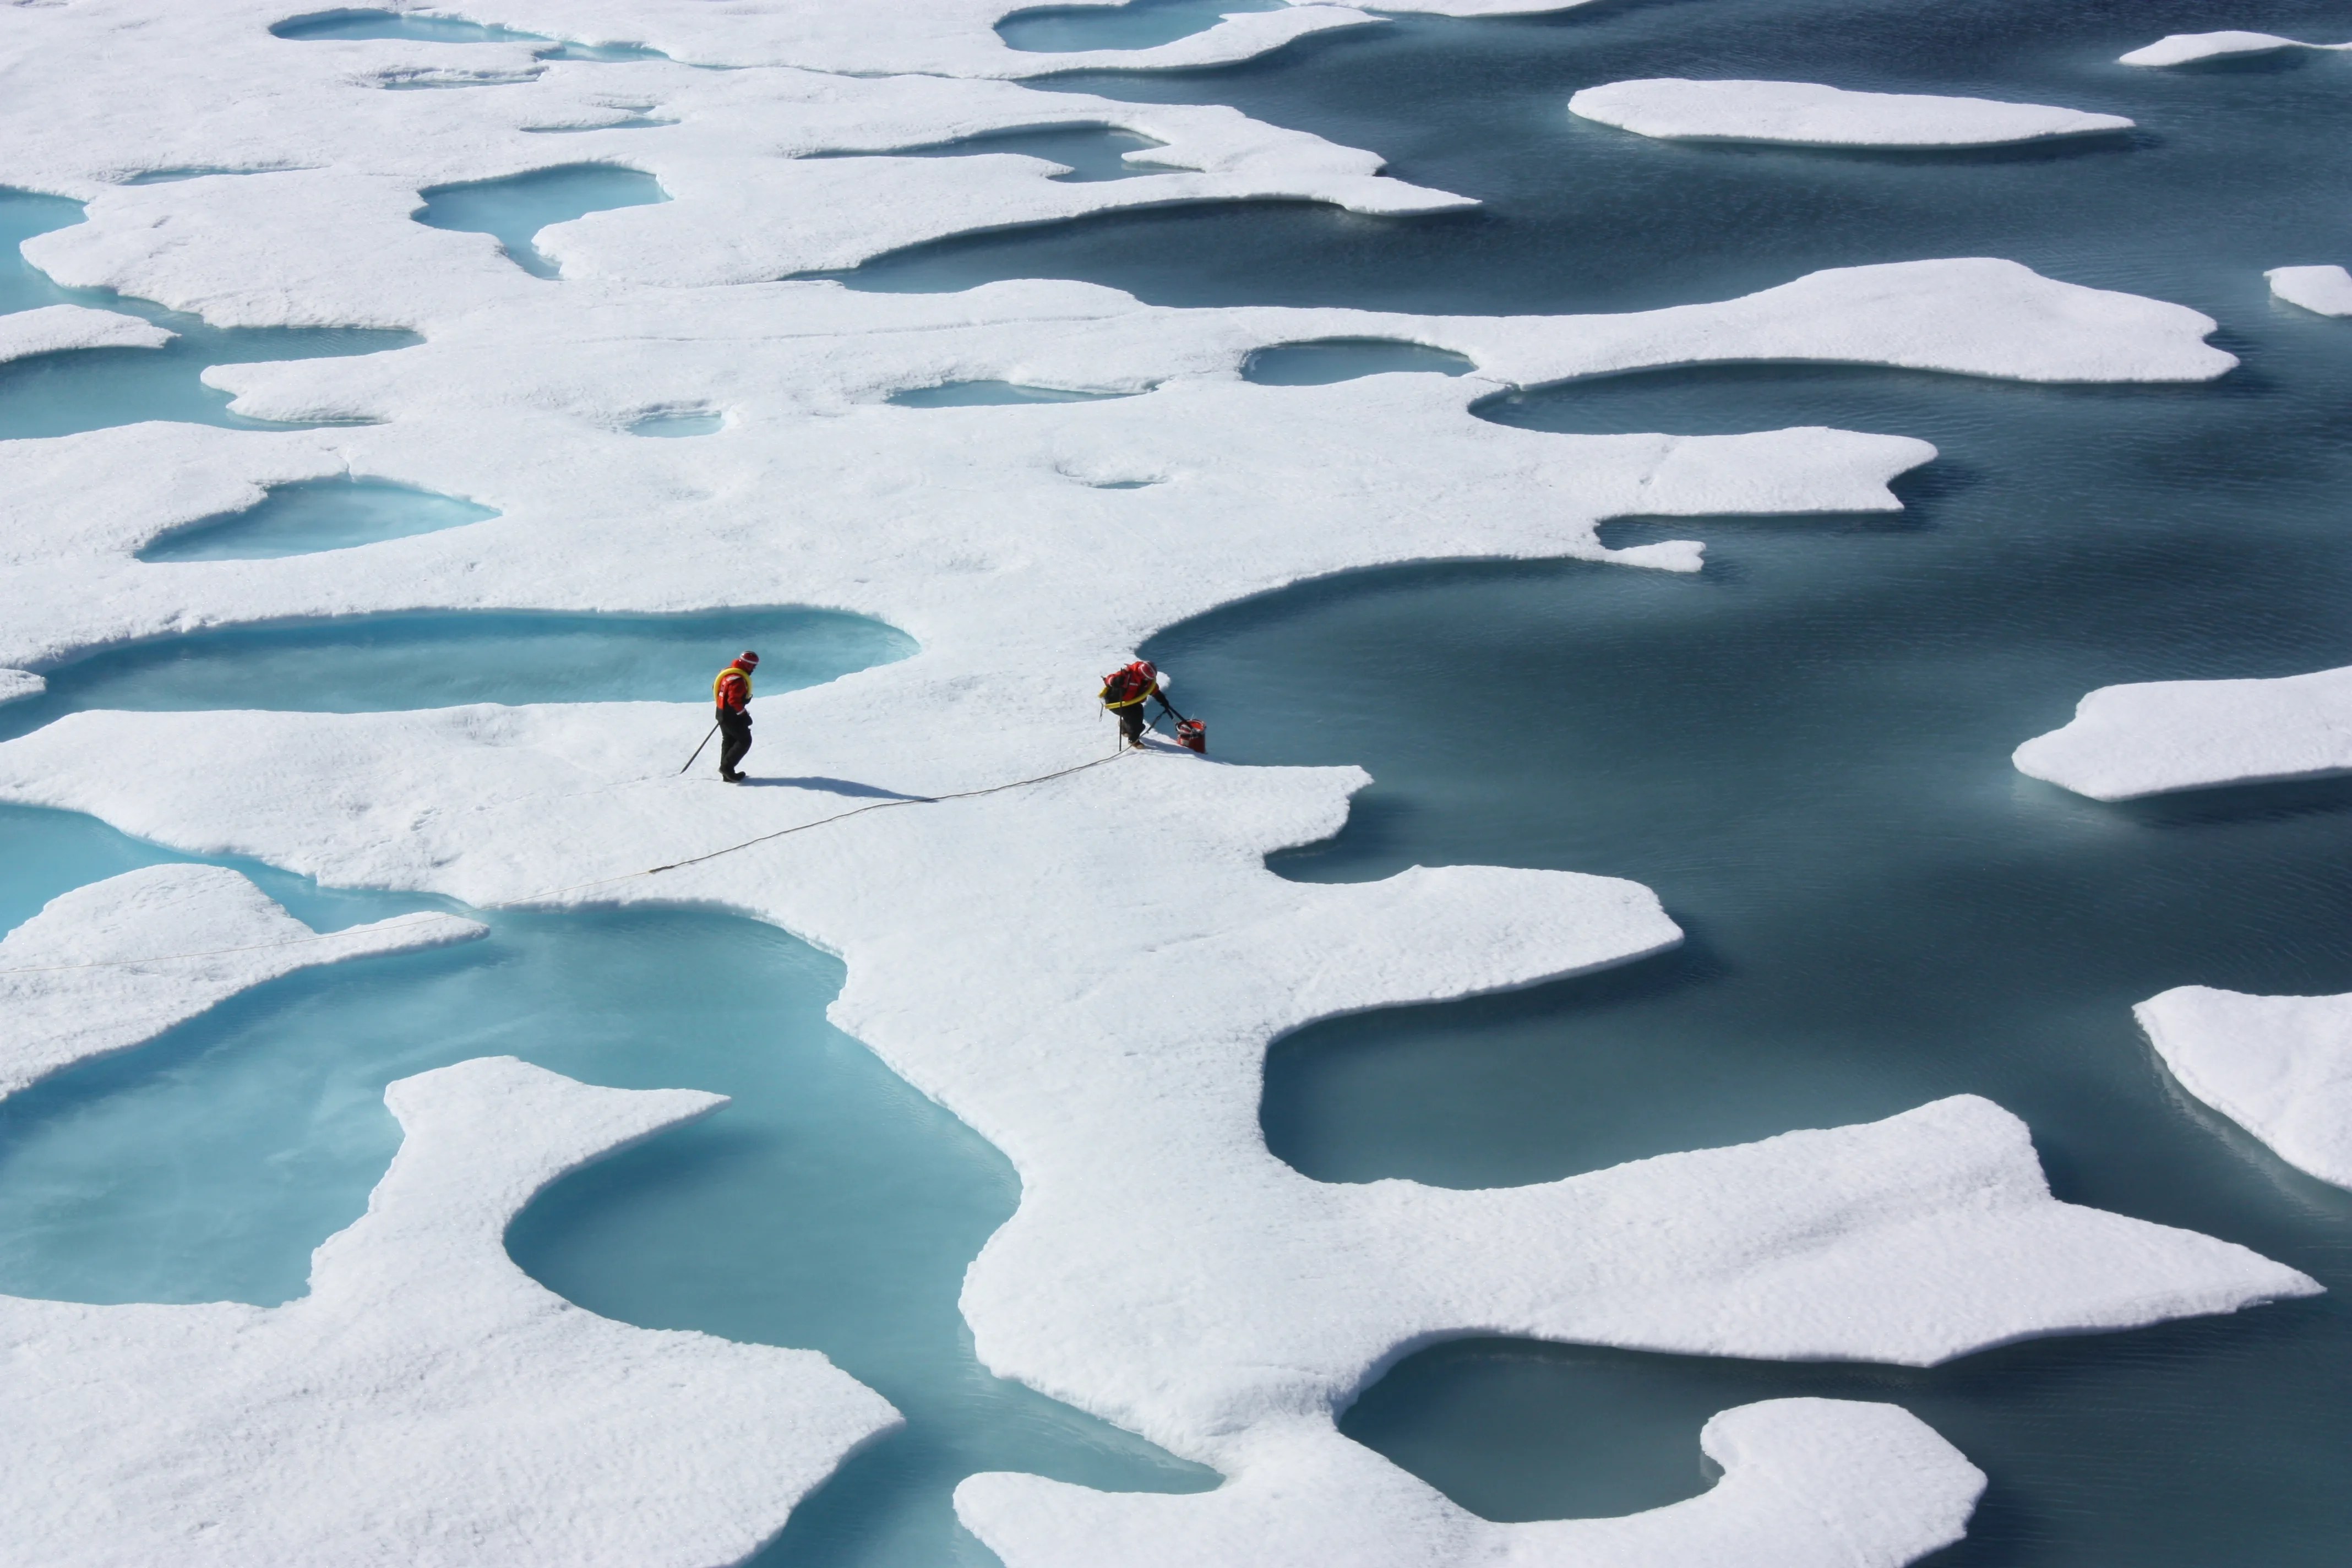
Earth Information Center
For more than 50 years, NASA satellites have provided data on Earth's land, water, air, temperature, and climate. NASA's Earth Information Center allows visitors to see how our planet is changing in six key areas: sea level rise and coastal impacts, health and air quality, wildfires, greenhouse gases, sustainable energy, and agriculture.
Start Exploring about Earth Information Center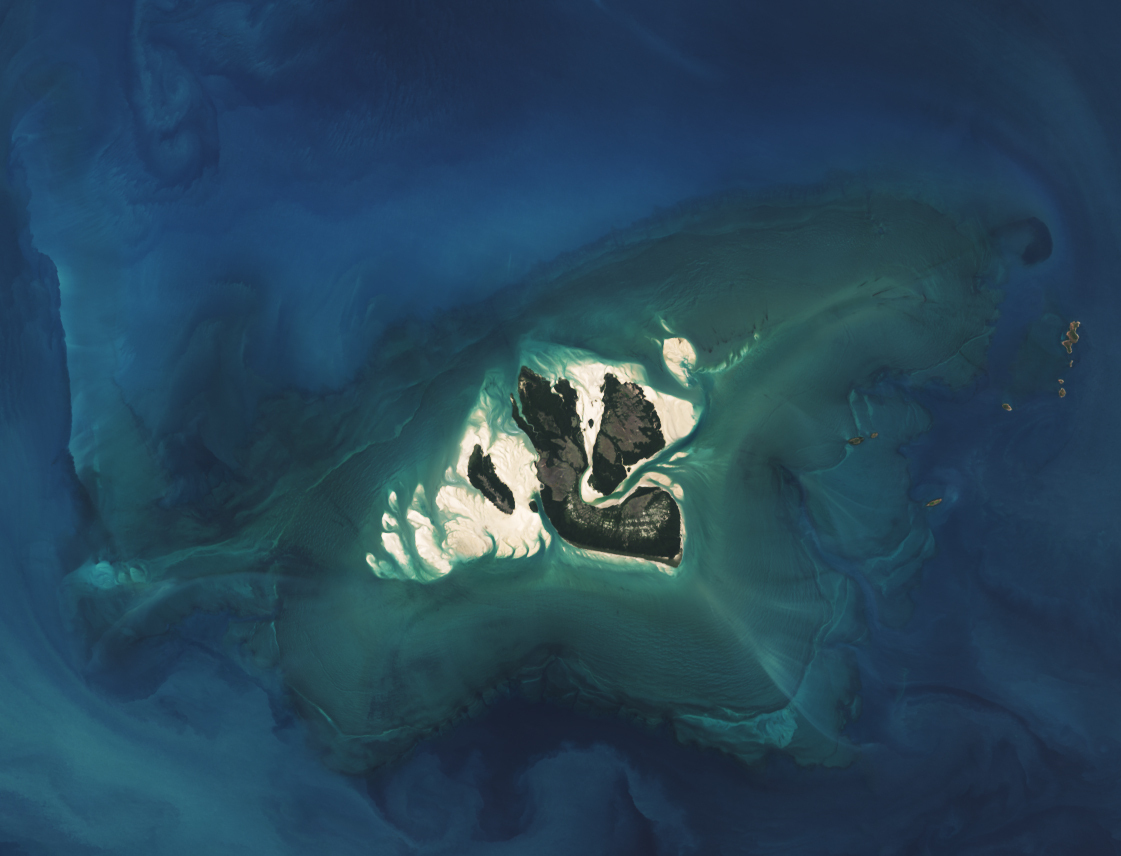
Today
Image Of The Day
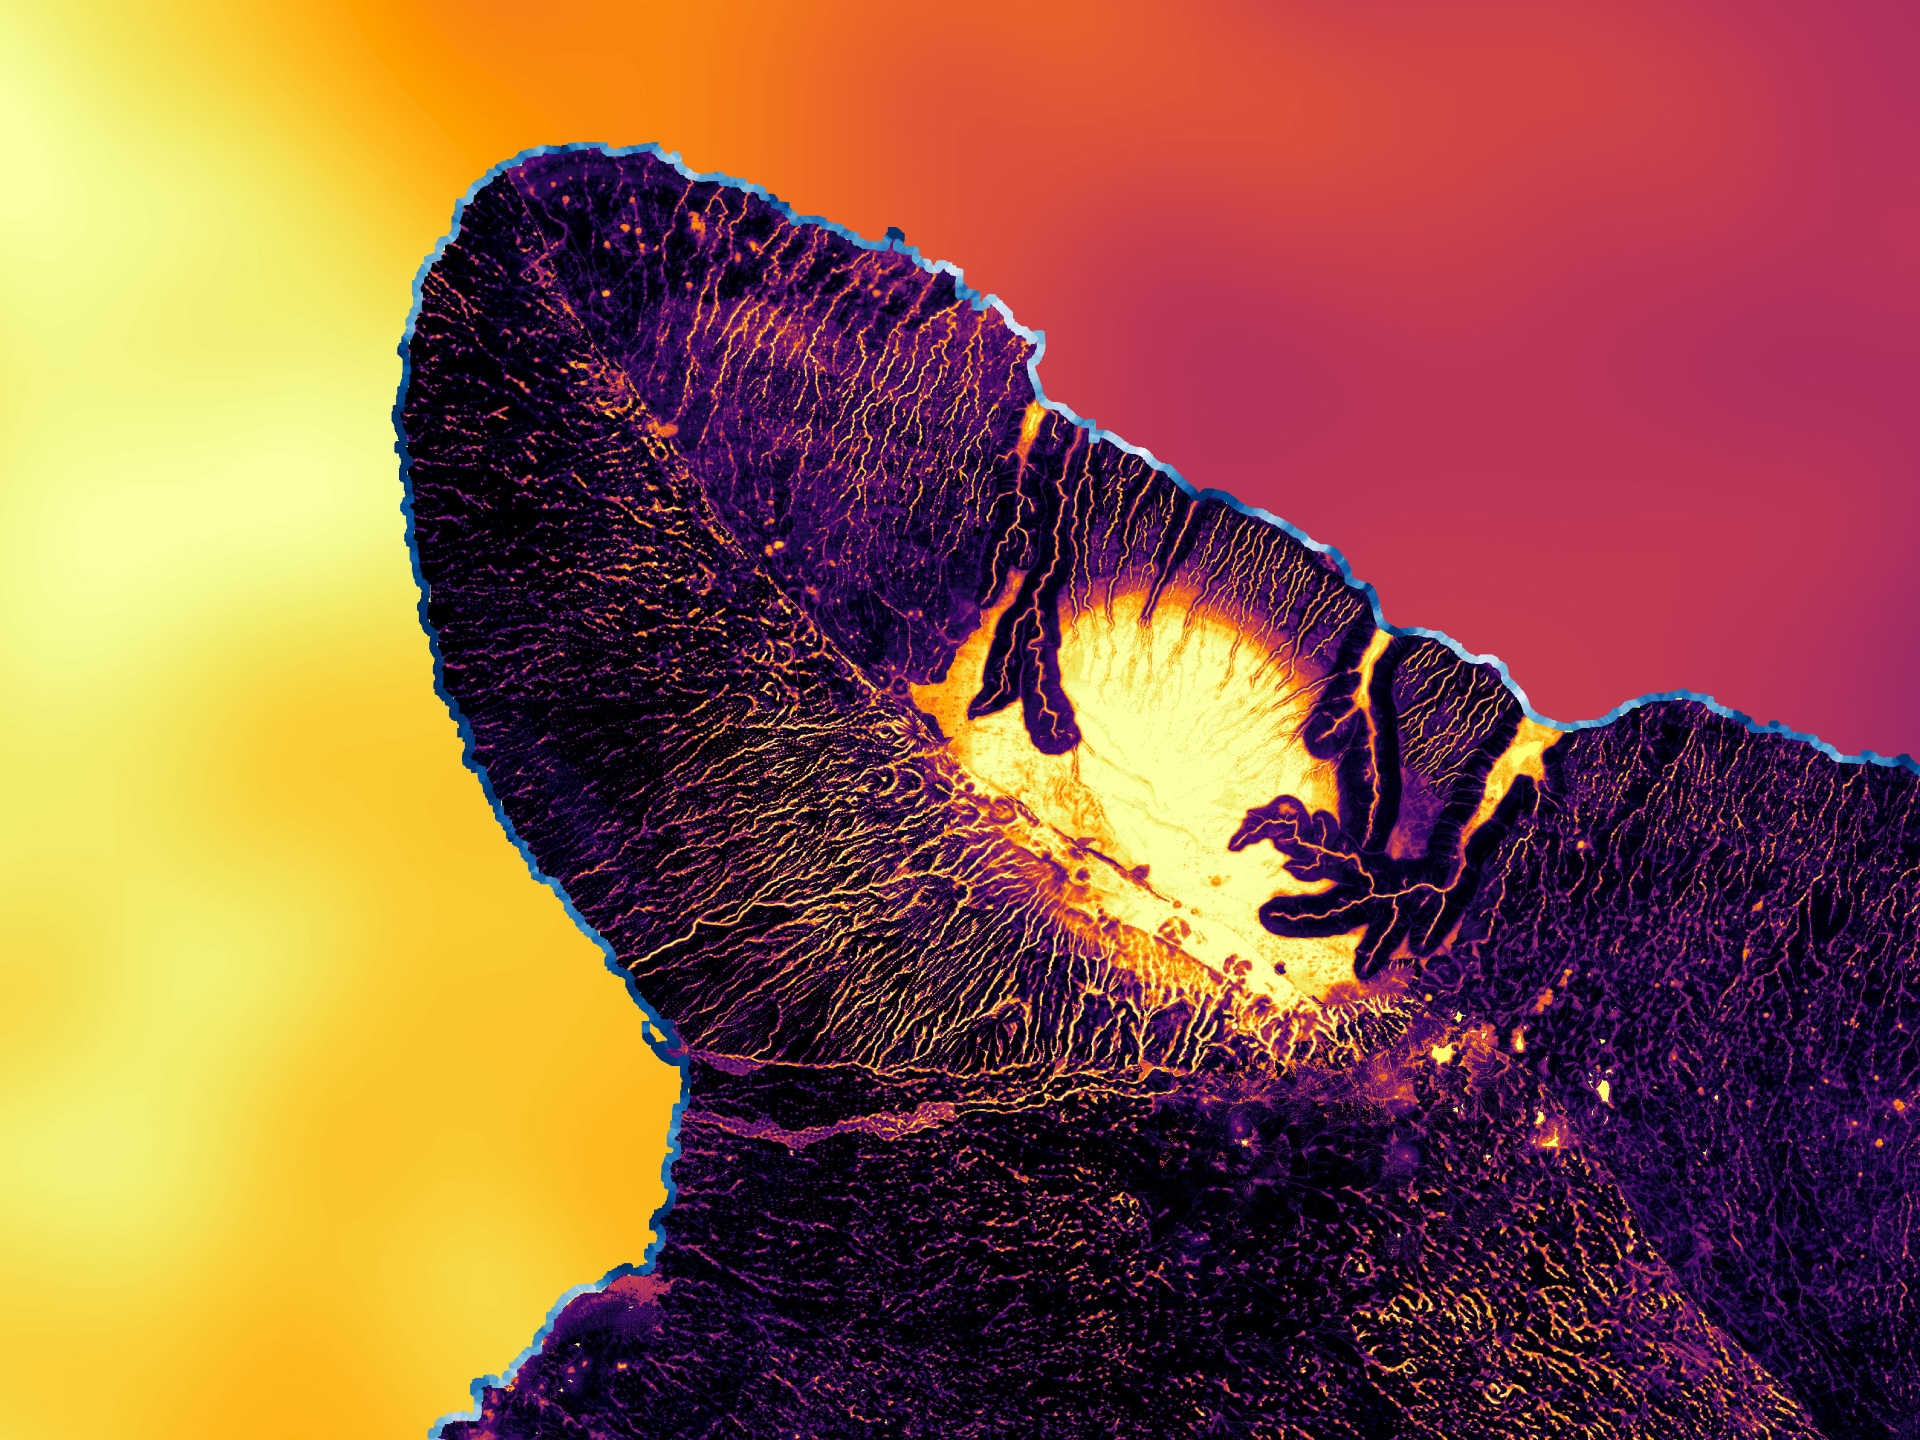
Modeling the Hawaiian Shoreline
Present-day Island of Hawai’i coastal flood risk, with higher risk indicated in dark blue, was modeled to help the County of Hawai’i in their shoreline setback plan. Sea Surface Temperature Anomaly data from 2022 Group for High Resolution Sea Surface Temperature Moderate Resolution Imaging Spectroradiometer (MODIS) indicate low temperatures in the East (red) to high in the West (orange). Inland, high probability locations of wetlands are shown in bright yellow and could aid in climate adaptation planning.

More NASA Images


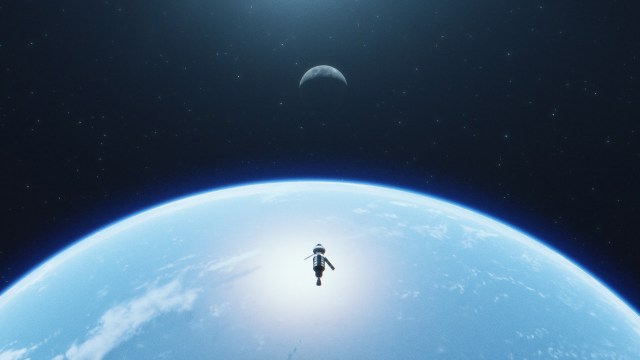
Explore the Universe from your Inbox
Stay up-to-date on the latest news from NASA–from Earth to the Moon, the Solar System and beyond.
We will never share your email address.
